A lot of my data projects involve Social Security Administration name data, so I had to find the best way to quickly create trend graphs of names.
For several years I've had a great interest in onomastics, the study of first names and their histories and origins. A big part of onomastics is also name trends and how characteristics of popular names evolve over time. The Social Security Administration has a data set that contains name data going back to 1880. Each year has every name given to at least five boys or at least five girls, resulting in tens of thousands of names that I can analyze the trends of.
This data set has sparked many projects for me, from "investigating" names that had sudden increases to creating a machine learning model to classify a name as masculine or feminine.
When I first downloaded the data, I had not yet learned Python, so I used Excel to store the data and create graphs. With the large amount of data, I had millions of cells filled. In order to create graphs displaying the name trends, I needed to be able to iterate through every column to search for the desired name, then get the count for each year. There was no formula in Excel that was able to do this, so I learned Visual Basic in order to implement my own method. Once I had the method, creating a graph for any name was as simple as typing it into a cell, but it was also very slow. It took upwards of thirty seconds to create one graph, but I was still pleased that the graphs generated.
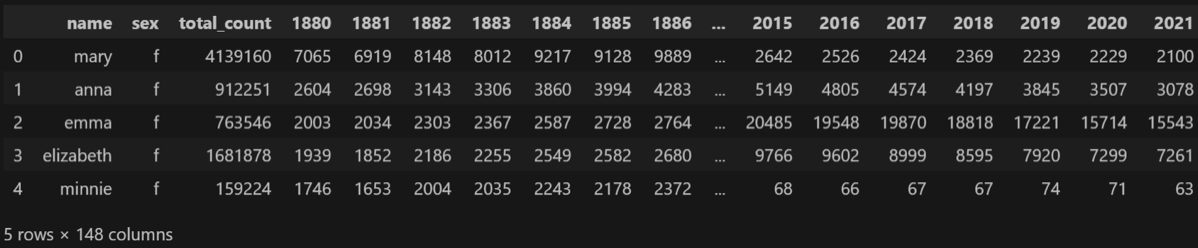
Since the data comes from the SSA in 145 text files, one for each year of data, I wanted an easy way to access all of the data at once. My specific goal was to have a program that could quickly display a graph of the number of babies given a name by year. Using Python and the Pandas library, I compiled 145 years of name data into a single DataFrame with a column for each year to hold the number of babies. The DataFrame is large, there are over 104,000 names across both male and female babies, but the time to create a graph is much faster than my previous methods for displaying name trends prior to learning Python.
Below are the first five rows of the DataFrame as an example.
A few projects out of many that I have done using SSA name data.